By: David Macchia
 Advisor Perspectives | December 21, 2021
Advisor Perspectives welcomes guest contributions. The views presented here do not necessarily represent those of Advisor Perspectives.
Capitalism’s death warrant was signed on March 19, 1968. That is when President Lyndon Johnson signed Public Law 90-269. With a stroke of his pen, Johnson eliminated the requirement that the Federal Reserve back the U.S. dollar with gold reserves. Whether it was understood at the time, what’s unfolded since would have been unimaginable to Johnson. Delinking the dollar from gold produced the conditions for breathless changes in monetary and fiscal policies, and the creation of an entirely new driver of economic growth.
Capitalism didn’t expire immediately. Eventually, however, policy makers, central bankers and politicians began to appreciate that they had at their disposal a magical ability to keep interest rates low and impact economic growth in entirely new ways.
Once this realization took hold, capitalism’s days were numbered.
If capitalism died, what took its place? The macro economist, Richard Duncan, has written extensively on this topic. Duncan’s term for the system that succeeded capitalism, the one based upon fiat money, is creditism. An author, lecturer and publisher of the video newsletter, Macro Watch, Duncan has shown that, unlike in the past when the economy grew as a result of businessmen and women saving and investing, earning profits – capital – and reinvesting their capital, today it is annual increases in the total volume of credit that makes the economy grow and keeps asset prices climbing. Duncan believes that this fact is the single most important thing to understand about today’s economy.
Credit explosion
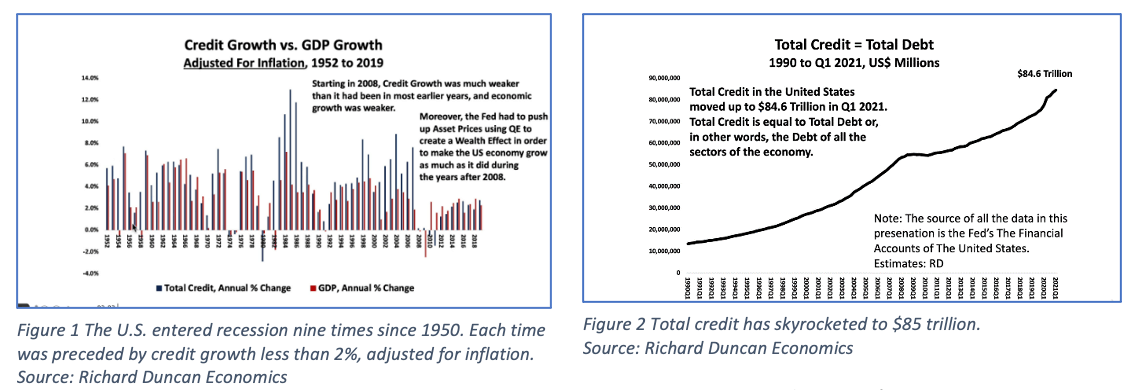
If credit growth is the driver of economic growth, then one would want to know exactly how much credit growth is required to maintain an expanding economy. The answer is, on an annual basis, credit must grow by a minimum of 2%, adjusted for inflation. This means, for example, that if inflation is 3%, the credit pie must increase by 5%. We know that this is true because, since 1950, the U.S. has experienced nine recessions. Each recession was immediately preceded by a period of total credit growth that sunk below 2%, adjusted for inflation.
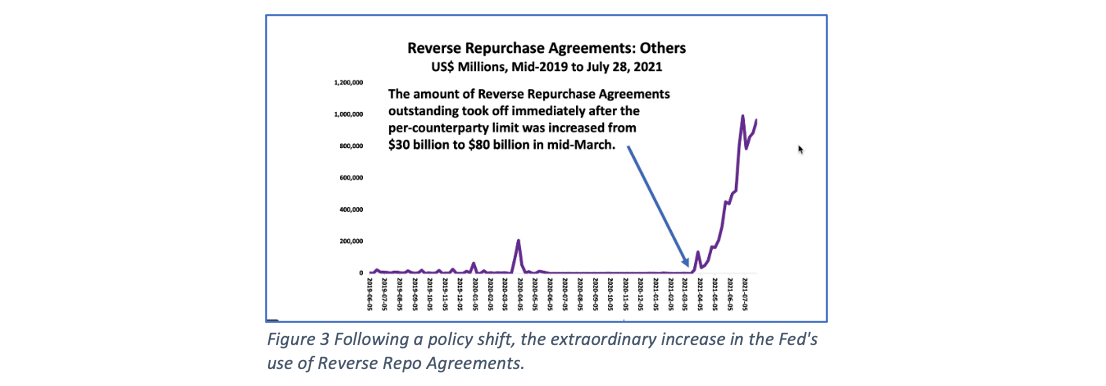
How massive has the credit pie has become? An incredibly large amount of money – $85 trillion. An important question emerges: On an ongoing basis, is it feasible that we can generate year-over-year increases in total credit equal to 2%, adjusted for inflation? Recently, there’s been only one way.
Because the other economic sectors (households, corporate, state & local governments, GSEs, non-corporate business, financial) cannot possibly absorb the amount of new credit required to meet the credit growth threshold, only the federal government has been able to make it possible. For example, from Q1 2020 thru Q2 2021, the federal government accounted for 64% of the total increase in credit.
Recently, the pace of credit growth has known no precedent. Through the mechanism of quantitative easing (QE), since August 2019, the Fed has created an additional $4.5 trillion. In a short period of time, the Fed’s total assets increased by 119%.
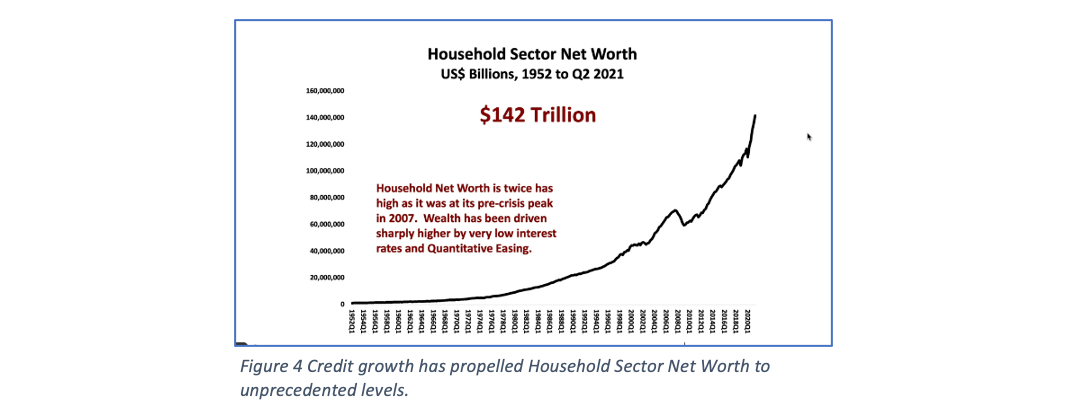
Bank reserves rocketed because the Fed made deposits in commercial banks’ reserve accounts. The flood of additional liquidity caused asset prices to soar. Duncan asserts that interest rates would have already collapsed into negative territory were it not for the Fed’s vastly increased usage of reverse repos.
Why do equity prices only go up?
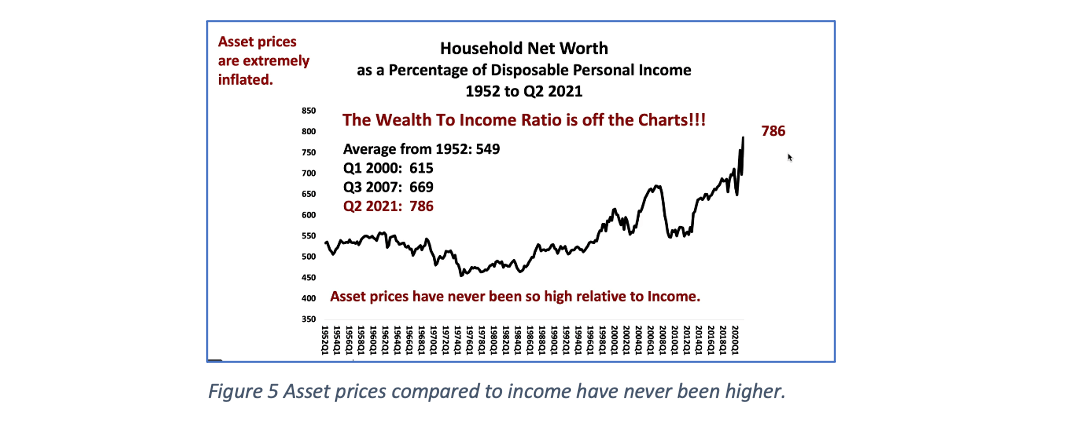
I’ve asked myself this question many times. Moreover, considering all of the money creation in recent years, I’ve wondered why we haven’t experienced high inflation or even hyper inflation? Creditism gives us the answers. When the real estate bubble burst in 2007, creditism enabled the Fed to create so much liquidity that we avoided falling into another Great Depression. Stock prices recovered quickly and, along with other assets such as real estate, values have only skyrocketed since. As of Q2 of this year, household net worth stood at an astounding $142 trillion, double that of the pre-crisis high in 2007. Is it a coincidence that total credit doubled during the same period?
Will the party continue? Perhaps not. Fearing that inflation may become deeper and longer lasting than it had originally assumed, the Fed recently announced that it will more quickly taper its monthly purchases of treasuries and mortgage-backed securities. As of today, the Fed intends to wind up its asset purchase program by March 2022. This shift will cause the rate of credit growth to slow considerably.
In addition, the FOMC signaled that interest rates are likely to increase beginning next year. In a recent video newsletter, Duncan stated, “If the markets begin to expect rate hikes, the dollar could strengthen substantially, with negative consequences for gold, other commodities, world trade, economic growth and corporate profits.”
The wealth-to-income ratio
Financial advisors should keep an eye on the wealth-to-income ratio. Thus far, creditism has caused asset prices to reliably increase to the point where they have become extremely inflated. This can be seen in an index the Fed publishes quarterly – Household Net Worth as a Percentage of Disposable Personal Income. For 50 years, the index moved within a range averaging 549. Immediately prior to the bursting of the .com bubble, the index had risen to an all-time high of 615. By 2007, the index had climbed again, to another all-time high of 669. Right after that, the real estate bubble burst. Today, the index stands at 790.
I suspect that many clients have come to expect that the Fed would both keep interest rate exceedingly low and continue to flood the financial markets with liquidity. Now that it is apparent that Fed policy is changing, will this spark a selloff in stocks?
A great deal of leverage has been employed for speculation. Could this make a potential selloff even more severe? And would higher interest rates strengthen the dollar? Given that central banks in Europe and Japan have kept their interest rates lower than the Fed has, a further widening of spreads is likely to strengthen the dollar. Said Duncan, “A stronger dollar tends to be bad for the global economy, corporate profits, gold, commodity prices, and other asset prices.”
The last time the dollar rose, June 2014 thru March 2015, commodity prices fell, world trade contracted, U.S. corporate profits fell, and stock prices stalled. During this period the Fed had paused QE. In response to the slowdown, the Fed resumed QE, pumping lots of money into the system. Asset prices catapulted upward. Creditism, once again, saved the day. But have you noticed that politicians have stopped talking about the size of our national debt?
Thirteen years after the last crisis, total credit has ballooned to $85 trillion. Will it be possible to keep generating increases in credit equal to 2%, adjusted for inflation? As of November, the CPI had increased 6.8% over the preceding 12 months. Is it realistic to think that the Government can expand total credit by another $7.48 trillion?
Financial advisors must answer this question: Will it be different this time?
Author’s note: My thanks to Richard Duncan for allowing me to use several charts from his Macro Watch newsletter. Duncan has graciously offered a 50% discount to any financial advisor who wishes to become a Macro Watch subscriber. If interested in a subscription, use discount code: Life

David Macchia is an author, retirement income industry entrepreneur and founder of Wealth2k, Inc. He is the developer of the widely used The Income for Life Model® as well as the recently introduced Women And Income™, the first retirement income solution developed for women investors.
Reproduced with permission from Advisor Perspectives, Inc. All rights reserved.